
Cassandra Database 4 Audit Logging
Azure Sentinel Custom logging using files

Open source databases are taking off and in particular non relational databases and their use in applications. In a recent scan and study security researchers found thousands upon thousands of open source databases open to the internet. In particular databases configured with the Security Defaults which generally are not sufficient in securing access and protecting data. As a former colleague at Microsoft Abel Wang would say “Never accept the Defaults !“

In the following guide we will walk through a popular NoSQL database Apache Cassandra deploying and configuring audit logs to be sent to Azure Sentinel. We will finish by using Azure Sentinel and a Function Parser to help make sense of the logs.
Alternatively you can also follow along in a video.
To begin with you can spin up a Azure Red Hat Linux 8.2 VM, a Log Analytics workspace and a storage account. Once the VM is up be sure to install the log analytics agent in the vm. Below are the loose notes to install Cassandra Database and the following link here is the full install documentation.
Next you will need to install a prerequisite for Cassandra DB - Java via:
yum install java-11-openjdk-devel

java -version
Then you will nee to install Cassandra DB:
nano /etc/yum.repos.d/cassandra.repoAdd the following and save in the text editor:
[cassandra]name=Apache Cassandra baseurl=https://downloads.apache.org/cassandra/redhat/40x/gpgcheck=1 repo_gpgcheck=1gpgkey=https://downloads.apache.org/cassandra/KEYSAfterwards you can run:
yum updateyum install cassandraYou can then start the service and test the database:
service cassandra start

service cassandra status
nodetool statusWith Cassandra DB up we can now configure the Cassandra Database audit log file. To do so we will need to use a text editor and change two files cassandra.yaml and logback.xml found in: /etc/cassandra/conf/ . Below are some notes on the procedure, the documentation found here can also be helpful.
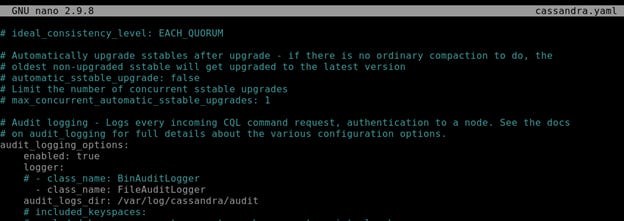
nano /etc/cassandra/conf/cassandra.yamlScroll to almost the bottom of the config and you will find a area for Audit logging
Make changes to the area but be careful as this is yaml and indentation matters !
switch enabled from false to true
Remark out the class_name: BinAuditLogger
add new line class_name: FileAuditLogger
unremark audit log dir and add /var/log/cassandra/audit
The changes should look like this, then go and save the configuration.
nano /etc/cassandra/conf/logback.xmlscroll down untill you find an area for appender name=”AUDIT”. Here you will uncomment <!— and —> areas. be careful and uncomment according to the pictures below or documentation example.


Save the logback.xml and restart the CassandraDB:
service cassandra restart
service cassandra status
notetool status
You can now create some audit events using cqlsh tool:
cqlshCREATE KEYSPACE synthwaveWITH replication = {'class':'SimpleStrategy', 'replication_factor' : 1};SELECT * FROM system_schema.keyspaces;quitOnce completed you can upload an example audit.log using azcopy.
First install azcopy following these instructions for Linux found here. Once installed navigate in the Azure Portal to a storage account and create a container called uploads, and generate a SAS Signature for the container to write to or use az cli. Run the following:
azcopy loginazcopy copy /var/log/cassandra/audit/audit.log "https://anewstoretotest01.blob.core.windows.net/linux?sp=racwdl&st=2021-09-30T22:42:07Z&se=2021-10-02T06:42:07Z&spr=https&sv=2020-08-04&sr=c&[SASSIG]Now that you have a sample audit.log file you can proceed and create a Custom Log. in the Azure Portal to log analytics Workspace - > Custom Logs → +Add
Log Name: CassandraAuditLog
OS: Linux
Custom File: /var/log/cassandra/audit/audit.log
For new line delineation chose TimeStamp and the first choice. With the Custom log added you may have to wait 10 - 20 minutes for the CassandraAuditLog_CL table to be indexed and populated with data in Log Searching. Keep testing and when you run:
CassandraAuditLog_CLyou will eventually get a few columns most important of which will be the RawData column. From this column we will build a KQL Query that will be saved as a Function Parser.
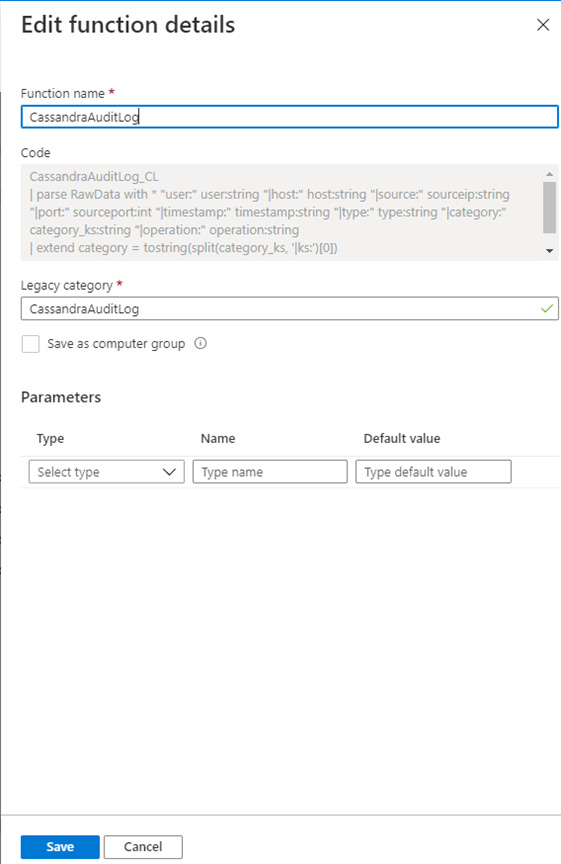
CassandraAuditLog_CL| parse RawData with * "user:" user:string "|host:" host:string "|source:" sourceip:string "|port:" sourceport:int "|timestamp:" timestamp:string "|type:" type:string "|category:" category_ks:string "|operation:" operation:string| extend category = tostring(split(category_ks, '|ks:')[0])| extend keyspace = tostring(split(category_ks, '|ks:')[1])Once the query is added and ran in Log Search go ahead and Save as Function. Provide the name as CassandraAuditLog and category as databases.

After a few minutes try and test just using the function parser name like:
CassandraAuditLog| summarize count() by keyspace,userI have made a pull request for the CassandraDB parser and it should become available here.
You can also check out the following video going into more detail and walkthrough of this install, configuration, collection of custom logs and an example of building a parser.
I hope you enjoyed this information and came away with some new knowledge. Until next time stay Synth.