
How to wire T-Pot events to Microsoft Sentinel
Manual Steps to understand what needs to be automated

In the previous post I walked you through the T-Pot project and efforts to be able to deploy T-Pot on a Azure Virtual network of your choosing. In the next step you may have deployed T-Pot to internet and want to send the data collected to Sentinel or leverage this as a Honeypot and generate alerts to your SOC. For now I am going to walk you through the manual steps to wire the data collected by Logstash on T-Pot and send it into Microsoft Sentinel for your SOC, TI, and other teams to leverage.
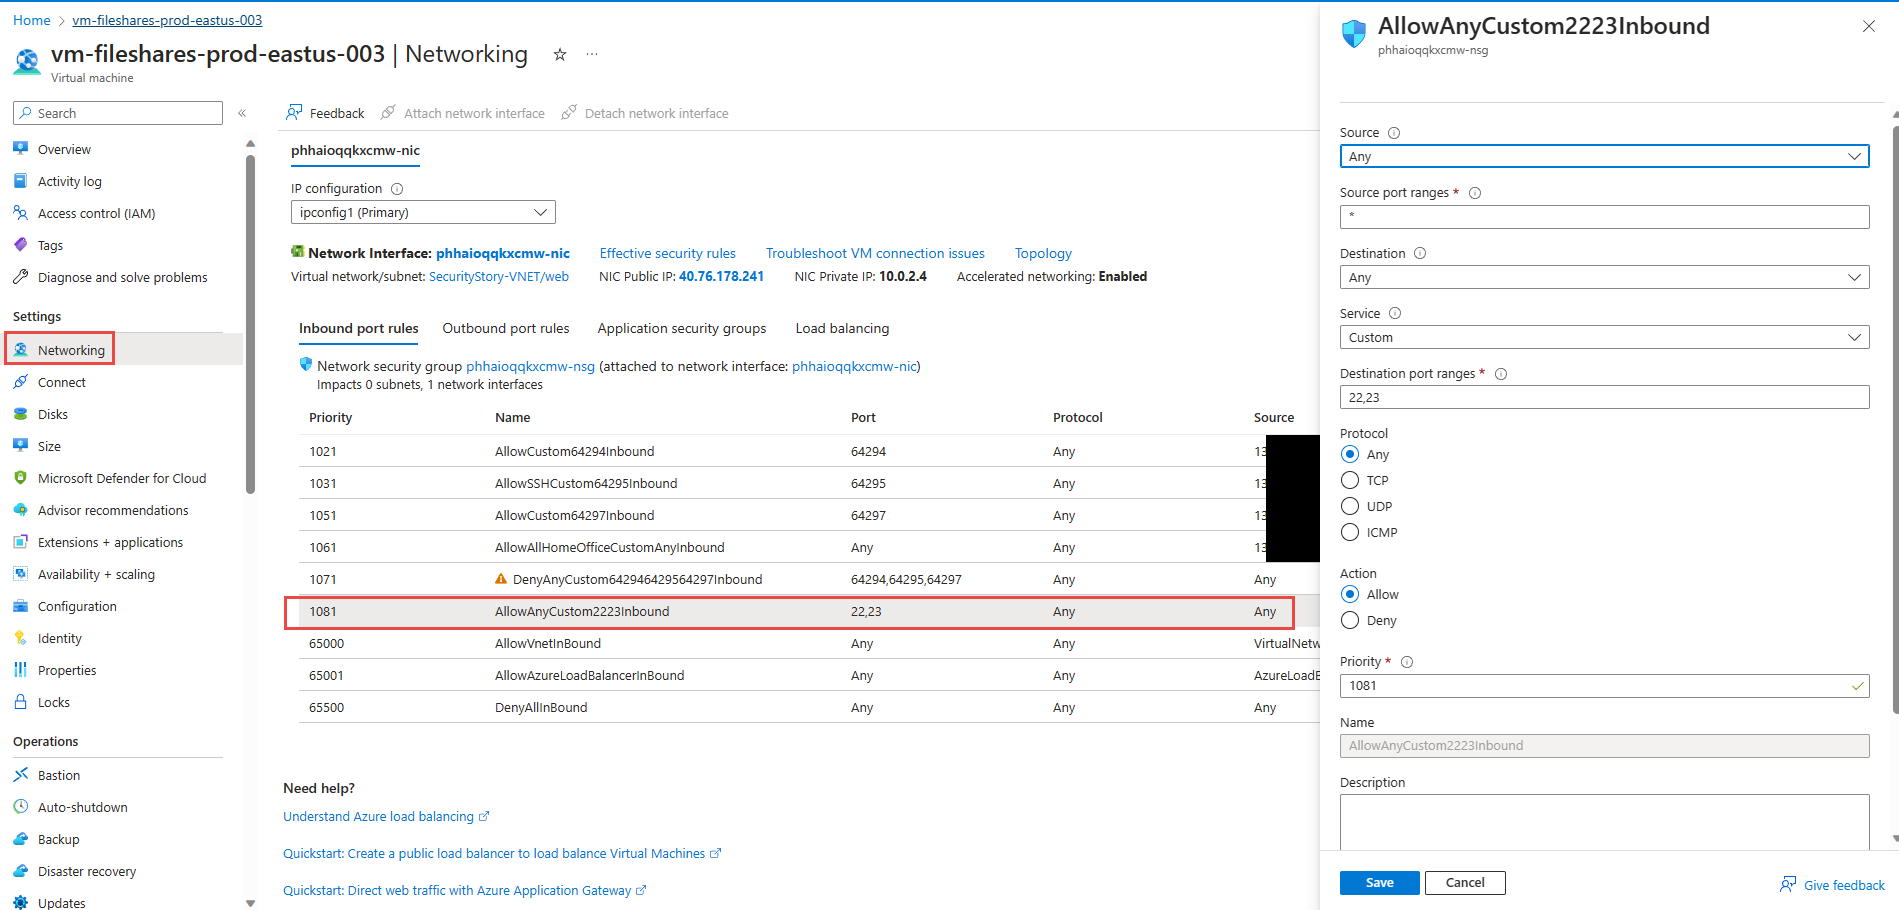
In our previous walkthrough scenario T-Pot has been deployed to Azure Virtual network and I have exposed Cowrie honeypot that operates on 22 (SSH) and 23 (Telnet) to the Internet. Recall that deploying the T-Pot on Azure will take 15 minutes or so to fully deploy the platform.
Microsoft Sentinel Configuration
To begin with you can deploy the Microsoft Sentinel prerequisites for collecting T-Pot’s data. You will send the events into a custom log using a Data Collection Rule (DCR) and a Data Collection Endpoint (DCE). The following steps below are derived from the following documentation regarding Logstash and DCR.
Create a Azure AD Application Registration, copy the appid, tenant id, and generate a key secret and copy them for later usage.
Create a Data Collection Endpoint by going to Azure Monitor and Data Collection Endpoints blade and adding a new DCE provide a name, in this example I called it cowrie-tpot-dce and deployed the DCE into a resource group where Log Analytics is also deployed. Very important after deployment go to the DCE Overview and copy the Log Ingestion uri , you will need this later in setup.
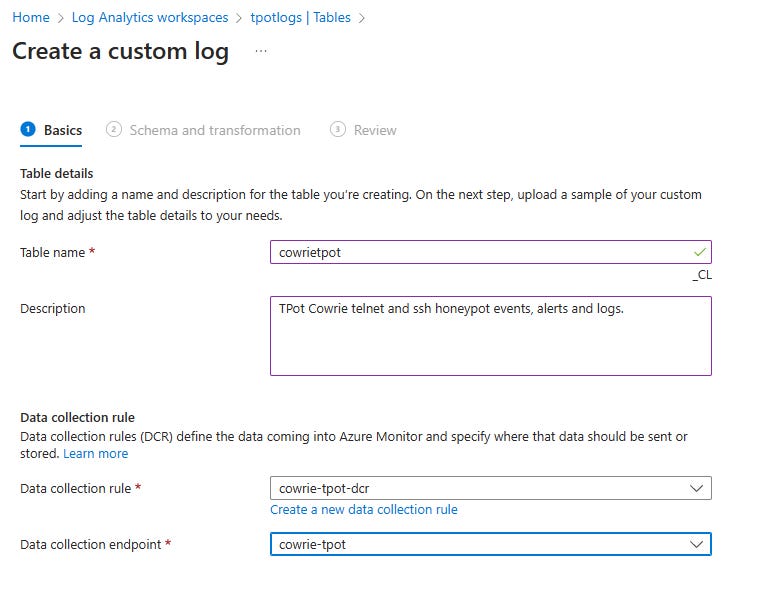
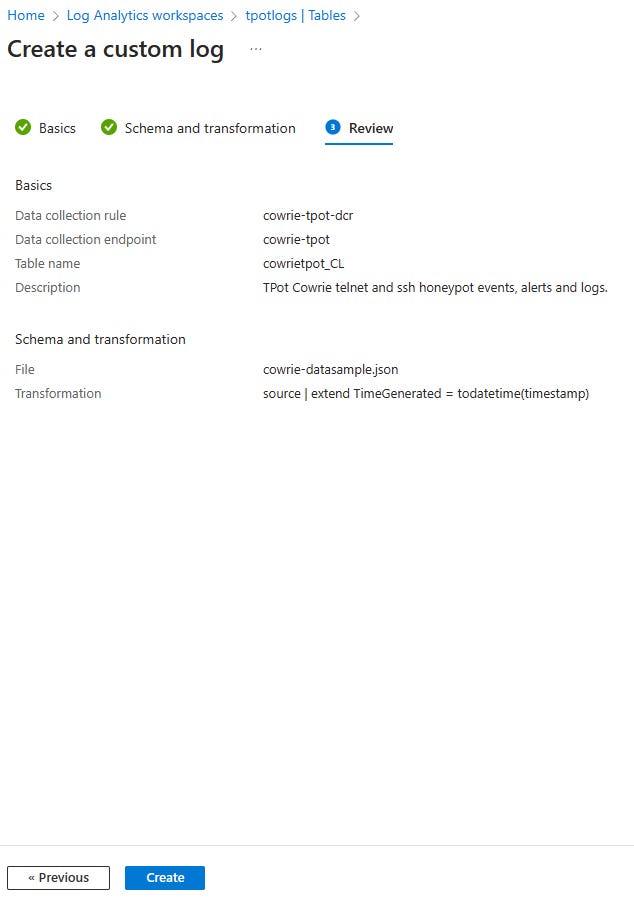
Create a new custom table that is DCR based. Provide a table name in this example cowrietpot
As part of the setup create a new data collection rule. In this example using a name cowrie-tpot-dcr and choose the DCE created in Step 2

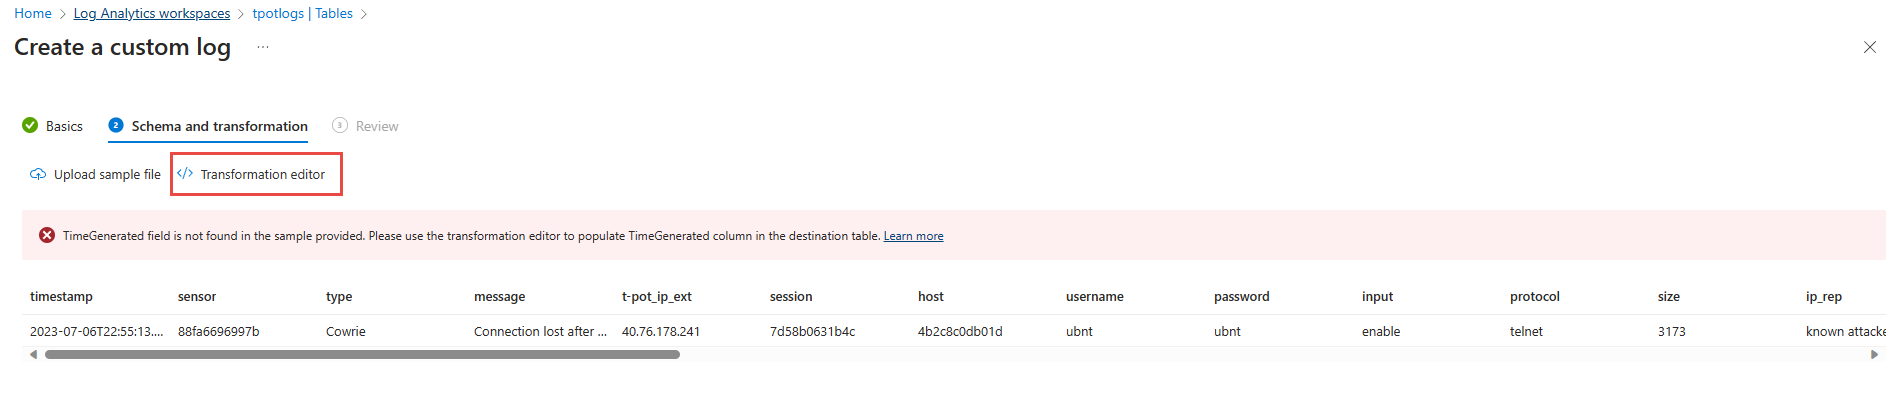
Next, on Schema and transformation download the sample data file for Cowrie here: and Upload sample file.

Click on Transformation Editor and add the following, run and apply
source| extend TimeGenerated = todatetime(timestamp)| project-rename tpotHostname = ['t-pot_hostname'], tpotExtipaddr = ['t-pot_ip_ext'], tpotIntipaddr = ['t-pot_ip_int'], honeypotType = typeClick next and then create.

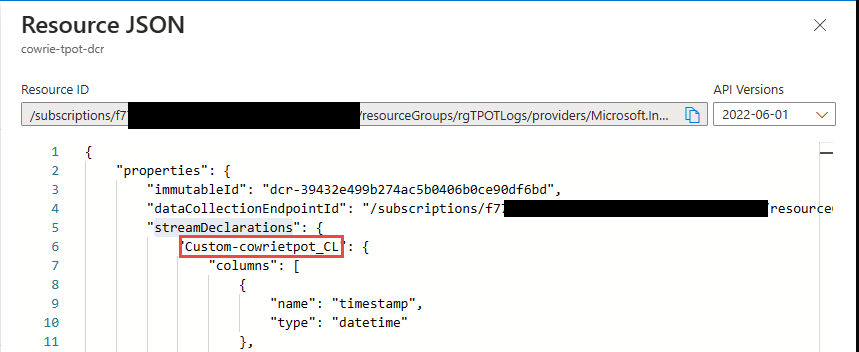
Go to Azure Monitor and the Sata Collection Rules blade and select cowrie-tpot-dcr and click the JSON View in top right corner and copy the immutableid
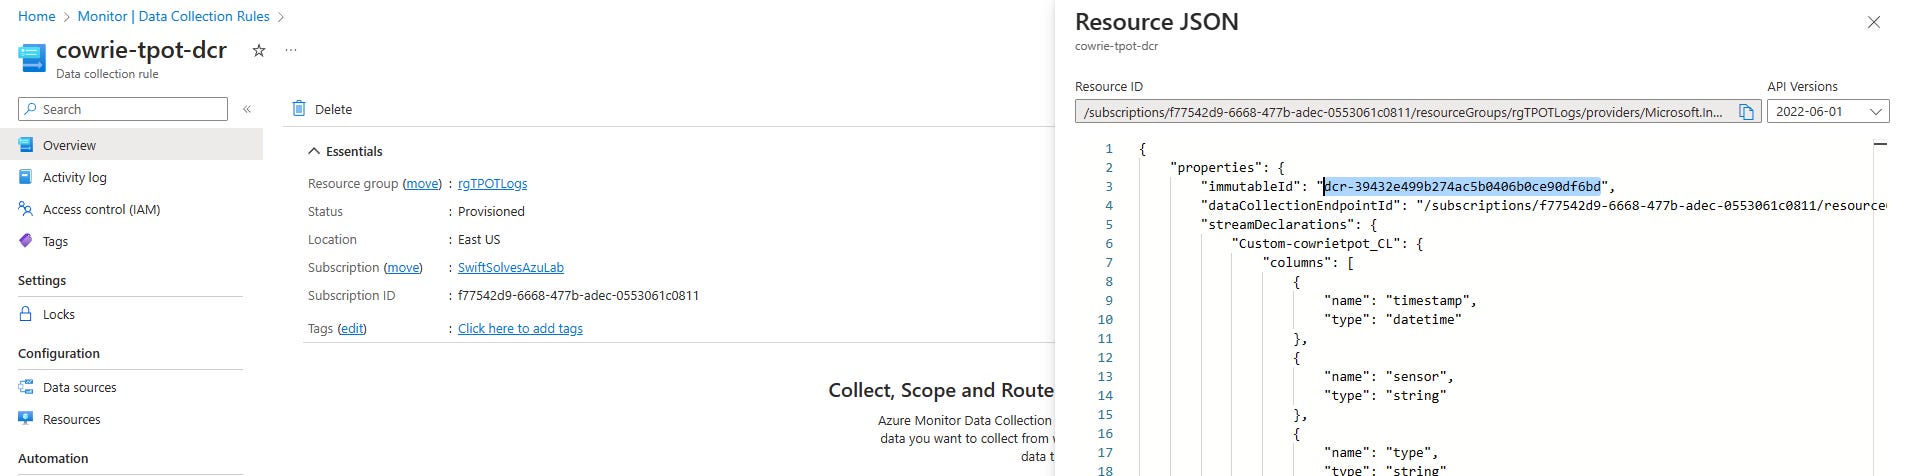
Copy the streamDeclarations json object name

On the DCR, click on Access Control (IAM) and add the Application Registration name from Step 1 earlier as a ‘Monitoring Metrics Publisher’ role, click review + assign.

Azure VM T-Pot Configuration
The next steps will involve updating Azure VM T-Pot to install microsoft-sentinel-logstash-output-plugin and configure the logstash.conf file for the new plugin to send data to Microsoft Sentinel.
Log into CockPit service via https://AzTPotPublicIP:64294/system/terminal
Click on the terminal tab and
sudo suRun the following bash commands to enter Logstash docker bash, copy logstash.conf to /data mount on T-Pot VM and exit Logstash docker bash:
docker exec -it logstash bash
cd /etc/logstash/
cp logstash.conf /data/elk/logstash.conf
exit
Stop tpot service:
systemctl stop tpotmodify the /data/elk/logstash.conf by scrolling close to the end and adding a second Output configuration for Microsoft Sentinel. Be sure to fill in the information collected from previous steps.
microsoft-sentinel-logstash-output-plugin {client_app_Id => ""client_app_secret => ""tenant_id => ""data_collection_endpoint => ""dcr_immutable_id => ""dcr_stream_name => "Custom-tpotcowrie_CL"compress_data => falsecreate_sample_file=> falsesample_file_path => "/data/temp"}Save the file and run the following to modify permissions to allow T-Pot service access.
chmod 760 /data/elk/logstash.conf
chown tpot:tpot /data/elk/logstash.conf
Next you will modify a Dockerfile for logstash at: /opt/tpot/docker/elk/logstash/Dockerfile ,
Insert the following line of code below the bin/logstash-plugin update
bin/logstash-plugin install microsoft-sentinel-logstash-output-plugin && \Save the file and in this next step you will now modify tpot.yml service file to install the Microsoft Sentinel plugin. with your editor edit the following file: /opt/tpot/etc/tpot.yml
remark # out the image and add the following lines with proper indents (two spaces). This will allow on next T-Pot service start to force a new image build using this information rather than pull the image from docker hub. It will also grab and use the copied and modified logstash.conf in /data you brought over and edited in the beginning of steps to use a Output plugin for Microsoft Sentinel.
## Logstash servicelogstash:build:
context: /opt/tpot/docker/elk/logstash
dockerfile: ./Dockerfile
container_name: logstashrestart: alwaysenvironment:- LS_JAVA_OPTS=-Xms1024m -Xmx1024mdepends_on:elasticsearch:condition: service_healthyenv_file:- /opt/tpot/etc/compose/elk_environmentmem_limit: 2g# image: "dtagdevsec/logstash:2204"
volumes:- /data:/data- /data/elk/logstash.conf:/etc/logstash/logstash.conf
Save the file and then run:
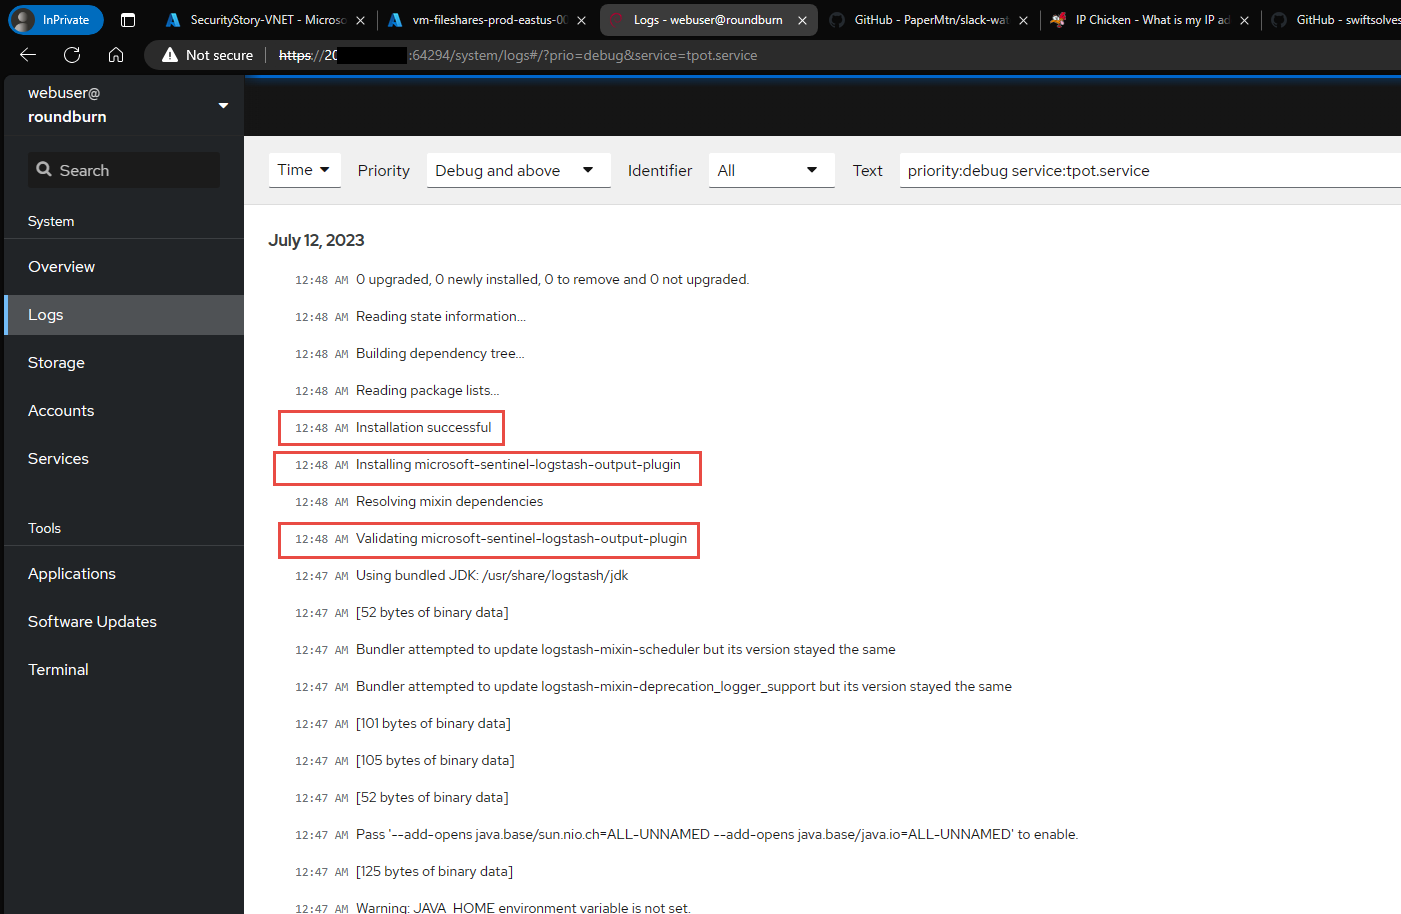
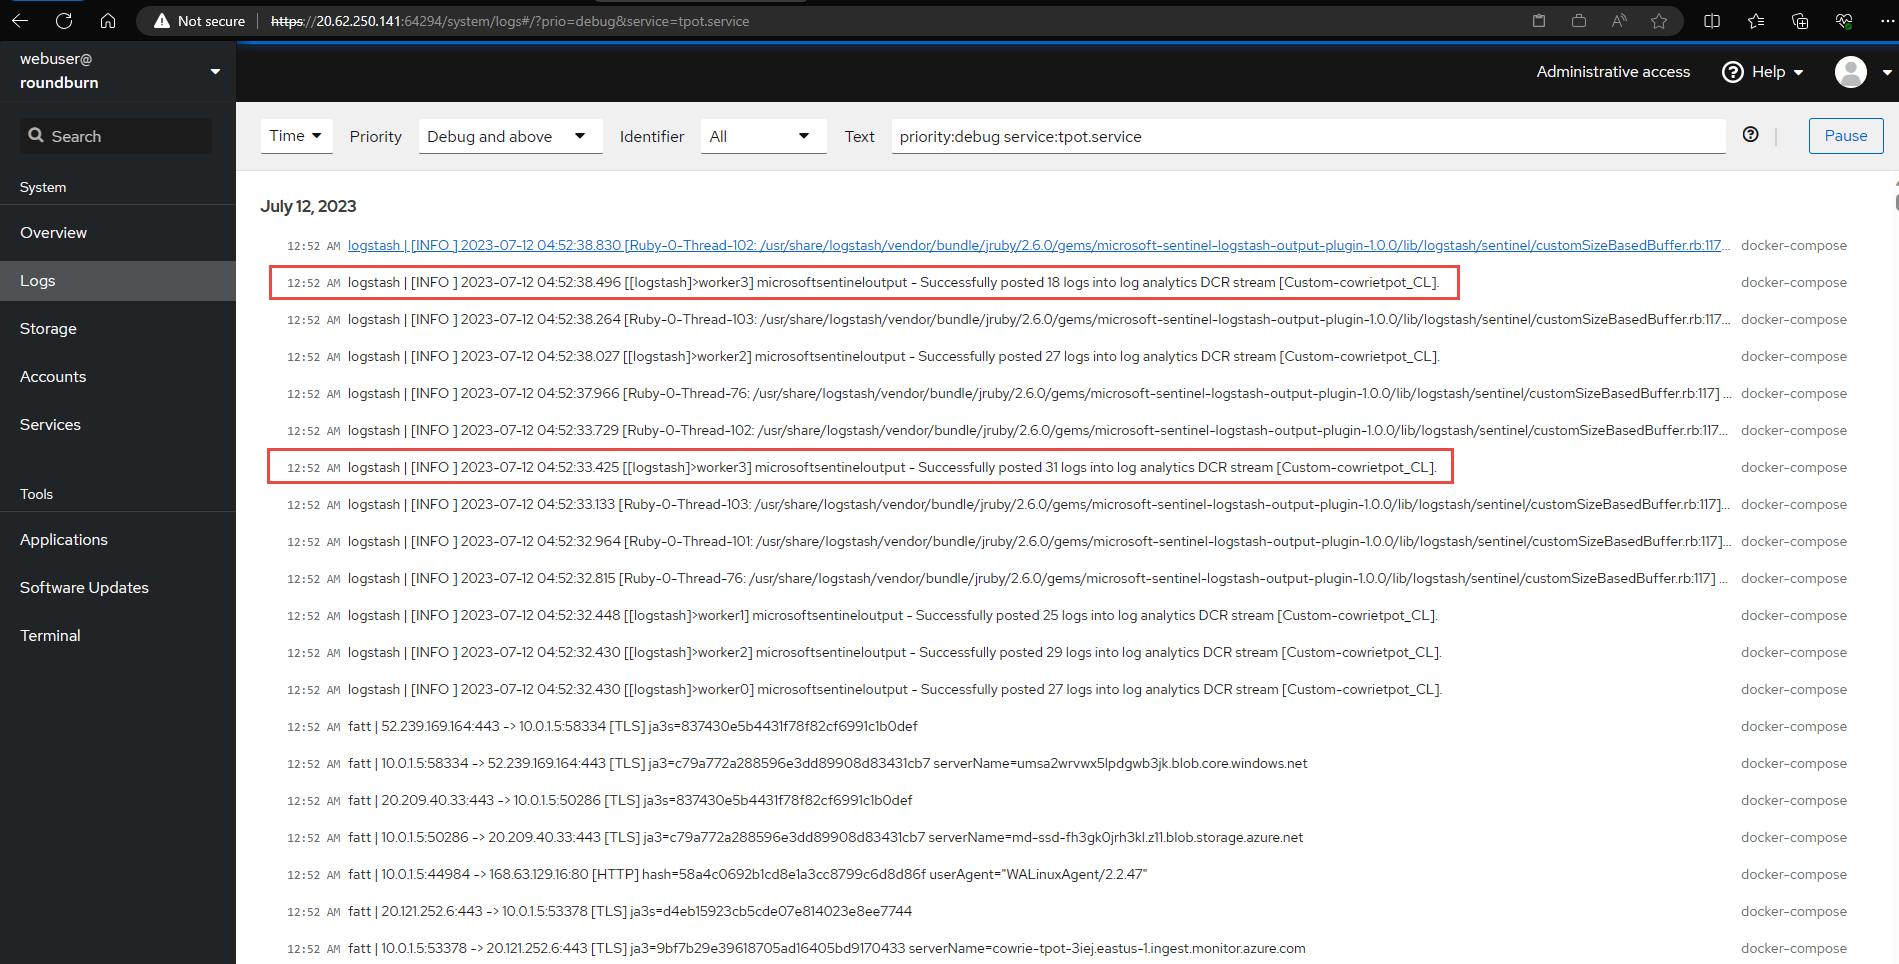
systemctl start tpotIn the CockPit service go to Services and scroll down to tpot service and goto All Logs - ensure the tpot service launches correctly without obvious errors on LogStash docker container. below are some signs of successful launch with new modifications

Afterwards you can test by using Putty or Azure Cloud Shell and SSH into the public ip address, login with fake credentials it may take a few times but the Honeypot will eventually let you in and from there run a few commands and quit.
Within a few minutes in Microsoft Sentinel you can query to see your login and the events.
cowrietpot_CL
| where honeypotType == 'Cowrie'
| sort by TimeGenerated asc
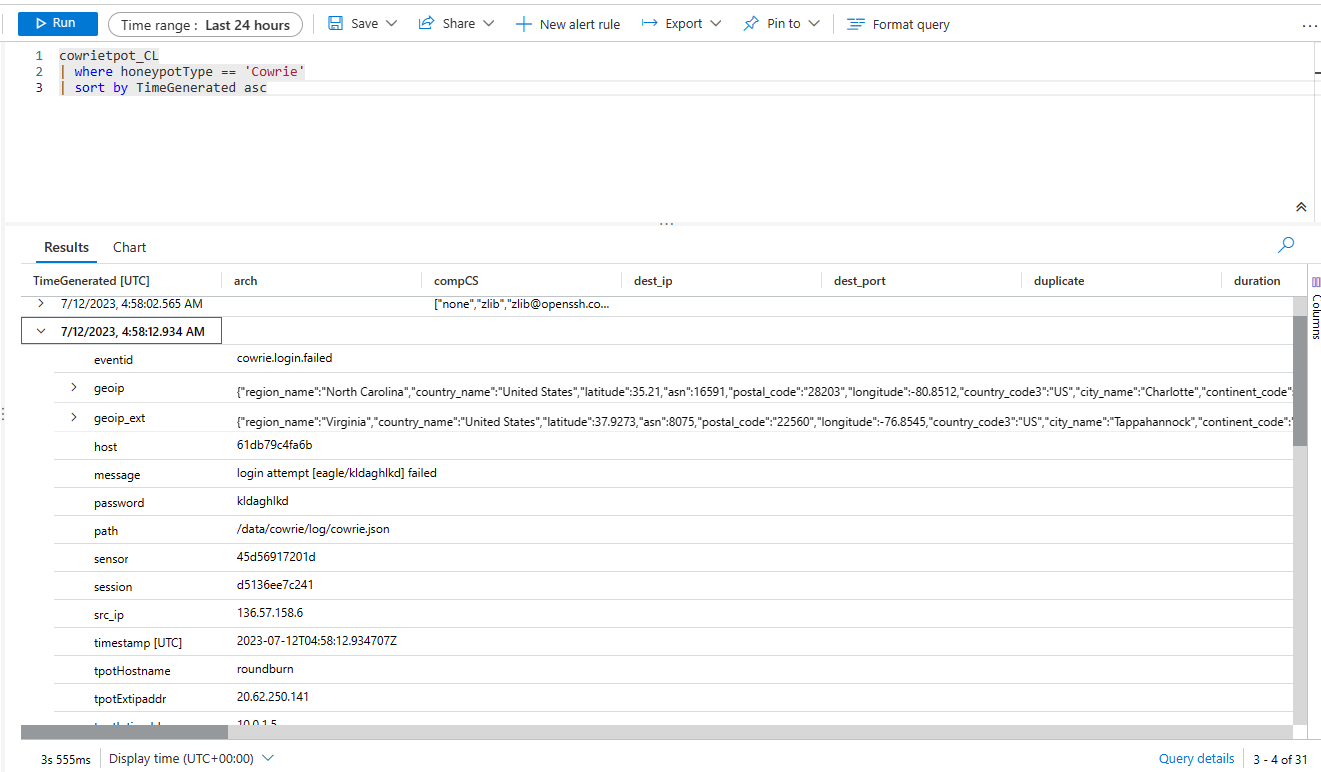
If you examine the table and logs further you will find that the configuration actually is sending all honeypot and tooling logs like Fatt, and Suricate as well. This can be very chatty especially Suricata. In out testing we just used a definition file for Cowrie, however a sample file for all of T-Pot’s logs, and a set of instructions, and a sample logstash.conf file can be found here
Closing Observations and Thoughts:
We now have manual steps to get Microsoft Sentinel output plugin installed and configured to send T-Pot’s logs over.
I need to find a way after post deployment to automate these steps and make it easy and possibly part of the ARM deployment. Possibly a Custom Script Extension calling a URI with a bash script ? However there is a race condition and timing issue of waiting until a service is webs request is available ensuring successful deployment of Cloud-Init.
I need to conduct more research into Logstash configuration and bifurcating each log source into it’s own Custom Table _CL
I need to conduct more research into Logstash configuration or Ingestion time transformations and drop events from known traffic patterns (Azure agent or Azure service communicating) for Fatt and Suricata logs to reduce log ingestion size.
I need to either create parsers for nested JSON data in logs or create ingestion time transformations to flatten the enriched data further.
I need to look into writing some pre canned Sentinel analytic rules for interactions with the Honeypots so if T-Pot is used privately and in a Hive + Sensor distribution in the enterprise and is interacted with you will have alerts and incidents generated.
In the Public facing scenario and gathering information, I want to write a Logic App to gather daily html summary information of honeypots interacted with and possibly write to watchlist or Threat Intelligence.
much more to try and get done in the Month of July !
Any update on your next steps?